
-
Including an interactive 3D `rgl` graphic in a html report with `knitr`
2013-03-08
SourceI posted a question on StackOverflow: how to embed an interactive 3D figure created with the
rglpackage into an html report created withknitr? The next day, Yihui Xie has posted a solution. He has updatedknitrto include this possibility.The first example
Below is the rendering of the example given by Yihui.
library(rgl)
knit_hooks$set(webgl = hook_webgl)
x <- sort(rnorm(1000)) y <- rnorm(1000) z <- rnorm(1000) + atan2(x, y) open3d() plot3d(x, y, z, col = rainbow(1000))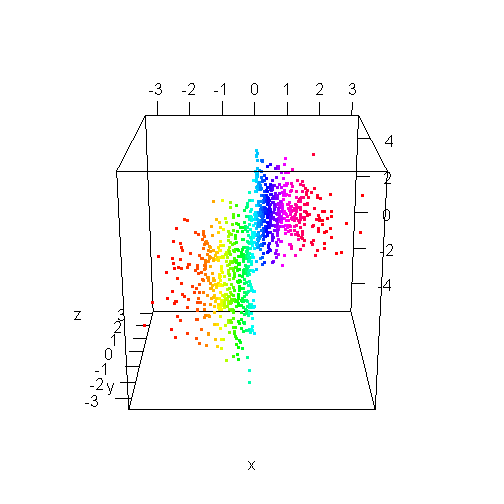
You must enable Javascript to view this page properly.A real-life motivated example
As a statistician consultant I sometimes have to write statistical reports about a response surface analysis. Wouldn't it be great to include an interactive response surface in a statistical report ? (At least, for fun --- I do not want to encourage an abusive practice of 3D visualization, even when it is interactive)
Russell V. Lenth's
rsmpackage provides convenient functions to draw the response surface fitted with thelm()funtion or thersm()function, as shown in the vignette Surface Plots in the rsm Package. Below is the interactiverglversion of the first example of the vignette.library(rsm) swiss2.lm <- lm(Fertility ~ poly(Agriculture, Education, degree = 2), data = swiss) open3d() persp3d.lm(swiss2.lm, Education ~ Agriculture, zlab = "Fertility")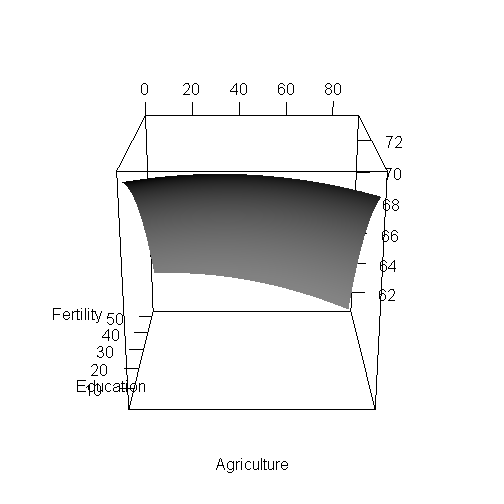
You must enable Javascript to view this page properly.I have obtained the function
persp3d.lm()I used above from thepersp.lm()function of thersmpackage by replacing every occurence of a call to thepersp()function (graphicspackage) with a call to thepersp3d()function (rglpackage). Thus this example is nothing but a default output whose aesthetics could be greatly improved with the possibilites of Adler & Murdoch'srglpackage.
- Home
- About
- PoirotReproducible Blogging with R Markdown
- SlidifyReproducible html5 slides from R markdown
- R-bloggersBlog posts about R, contributed by R bloggers worldwide.
- stla.overblogMy previous blog
- Timely Portfolio A great blog about R, Javascript, and more