
-
A reactive sliced 3D surface response
2013-03-15
SourceIn my previous article I showed an interactive 3D surface response fitted from a model with two continous predictors. But when there is more than two continuous predictors, since we can use only two predictors at time in the image, we can only show a surface plot depending on the fixed values of the other predictors. Here we will build a
Shinyapplication allowing to visualize a surface plot reactive to the values of the other predictors.For our illustration we use the (coded) dataset
heliavailable in thersmpackage. The variables are coded variablesx1,x2,x3,x4, which respectively are: linear functions of wing areaA, wing length ratioR, body widthW, and body lengthL. The experiment was run in two blocks, and the response variable isave, the average flight time in seconds.library(rsm) print(heli)## block A R W L ave logSD ## 1 1 11.8 2.26 1.00 1.5 367 72 ## 2 1 13.0 2.26 1.00 1.5 369 72 ## 3 1 11.8 2.78 1.00 1.5 374 74 ## 4 1 13.0 2.78 1.00 1.5 370 79 ## 5 1 11.8 2.26 1.50 1.5 372 72 ## 6 1 13.0 2.26 1.50 1.5 355 81 ## 7 1 11.8 2.78 1.50 1.5 397 72 ## 8 1 13.0 2.78 1.50 1.5 377 99 ## 9 1 11.8 2.26 1.00 2.5 350 90 ## 10 1 13.0 2.26 1.00 2.5 373 86 ## 11 1 11.8 2.78 1.00 2.5 358 92 ## 12 1 13.0 2.78 1.00 2.5 363 112 ## 13 1 11.8 2.26 1.50 2.5 344 76 ## 14 1 13.0 2.26 1.50 2.5 355 69 ## 15 1 11.8 2.78 1.50 2.5 370 91 ## 16 1 13.0 2.78 1.50 2.5 362 71 ## 17 1 12.4 2.52 1.25 2.0 377 51 ## 18 1 12.4 2.52 1.25 2.0 375 74 ## 19 2 11.2 2.52 1.25 2.0 361 111 ## 20 2 13.6 2.52 1.25 2.0 364 93 ## 21 2 12.4 2.00 1.25 2.0 355 100 ## 22 2 12.4 3.04 1.25 2.0 373 80 ## 23 2 12.4 2.52 0.75 2.0 361 71 ## 24 2 12.4 2.52 1.75 2.0 360 98 ## 25 2 12.4 2.52 1.25 1.0 380 69 ## 26 2 12.4 2.52 1.25 3.0 360 74 ## 27 2 12.4 2.52 1.25 2.0 370 86 ## 28 2 12.4 2.52 1.25 2.0 368 74 ## 29 2 12.4 2.52 1.25 2.0 369 89 ## 30 2 12.4 2.52 1.25 2.0 366 76 ## ## Data are stored in coded form using these coding formulas ... ## x1 ~ (A - 12.4)/0.6 ## x2 ~ (R - 2.52)/0.26 ## x3 ~ (W - 1.25)/0.25 ## x4 ~ (L - 2)/0.5print(heli, decode=FALSE)## block x1 x2 x3 x4 ave logSD ## 1 1 -1 -1 -1 -1 367 72 ## 2 1 1 -1 -1 -1 369 72 ## 3 1 -1 1 -1 -1 374 74 ## 4 1 1 1 -1 -1 370 79 ## 5 1 -1 -1 1 -1 372 72 ## 6 1 1 -1 1 -1 355 81 ## 7 1 -1 1 1 -1 397 72 ## 8 1 1 1 1 -1 377 99 ## 9 1 -1 -1 -1 1 350 90 ## 10 1 1 -1 -1 1 373 86 ## 11 1 -1 1 -1 1 358 92 ## 12 1 1 1 -1 1 363 112 ## 13 1 -1 -1 1 1 344 76 ## 14 1 1 -1 1 1 355 69 ## 15 1 -1 1 1 1 370 91 ## 16 1 1 1 1 1 362 71 ## 17 1 0 0 0 0 377 51 ## 18 1 0 0 0 0 375 74 ## 19 2 -2 0 0 0 361 111 ## 20 2 2 0 0 0 364 93 ## 21 2 0 -2 0 0 355 100 ## 22 2 0 2 0 0 373 80 ## 23 2 0 0 -2 0 361 71 ## 24 2 0 0 2 0 360 98 ## 25 2 0 0 0 -2 380 69 ## 26 2 0 0 0 2 360 74 ## 27 2 0 0 0 0 370 86 ## 28 2 0 0 0 0 368 74 ## 29 2 0 0 0 0 369 89 ## 30 2 0 0 0 0 366 76 ## ## Variable codings ... ## x1 ~ (A - 12.4)/0.6 ## x2 ~ (R - 2.52)/0.26 ## x3 ~ (W - 1.25)/0.25 ## x4 ~ (L - 2)/0.5A second-order response-surface model for these data is fitted using
heli.rsm <- rsm(ave ~ block + SO(x1,x2,x3,x4), data = heli)The fitted surface response is shown below as a function of
x3andx4with the values ofx1andx2both fixed at \(0\):persp(heli.rsm, ~x3+x4, at=list(x1=0,x2=0), col = rainbow(50), contours = "colors")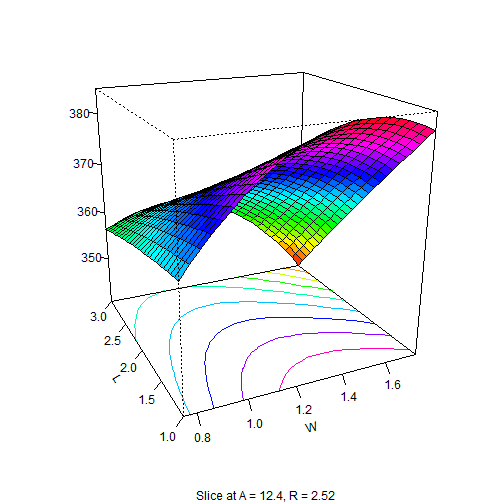
Now we build a
Shinyapplication which does the same plot with reactive values ofx1andx2.ui.R file defining the user interface:
library(shiny)
library(rsm)

shinyUI(pageWithSidebar(

  # Application title
  headerPanel("Sliced 3D plot"),

  # Sidebar with two slider inputs
  sidebarPanel(
    sliderInput("Aslice",
                "A:",
                min = 11.8,
                max = 13,
                value = 12.4),
    sliderInput("Rslice",
               "R:",
                min = 2.26,
                max = 2.78,
                value = 2.52)
  ),

  # Show plot
  mainPanel(
    plotOutput("surfPlot")
  )
))
server.R file drawing the surface:
library(shiny)
library(rsm)

heli.rsm <- rsm(ave ~ block + SO(x1,x2,x3,x4), data = heli)

shinyServer(function(input, output){
  output$surfPlot <- renderPlot({
    x1 <- (input$Aslice - 12.4)/0.6
    x2 <- (input$Rslice - 2.52)/0.26
    persp(heli.rsm, ~x3+x4, at=list(x1=x1,x2=x2), col = rainbow(50), contours = "colors")
    })
})
This
Shinyapplication you see below is actually hosted at myShiny beta hosting accountShinyApps hosting account and is accessible at https://stla.shinyapps.io/3Dsliced. I have embedded it here by typing the following html code:<iframe src="https://stla.shinyapps.io/3Dsliced/" style="border: none; width: 900px; height: 500px"></iframe>An interactive and reactive 3D plot ?
Similarly to interactive plots, reactive 3D plots embedded into a html report are great. Now, how to embed an interactive and reactive 3D plot ? There is an open discussion about this possibility in the Shiny Google group. It's just a matter of time. How could we be able to afford to press the R developers who freely provide these wonderful tools ?
- Home
- About
- PoirotReproducible Blogging with R Markdown
- SlidifyReproducible html5 slides from R markdown
- R-bloggersBlog posts about R, contributed by R bloggers worldwide.
- stla.overblogMy previous blog
- Timely Portfolio A great blog about R, Javascript, and more