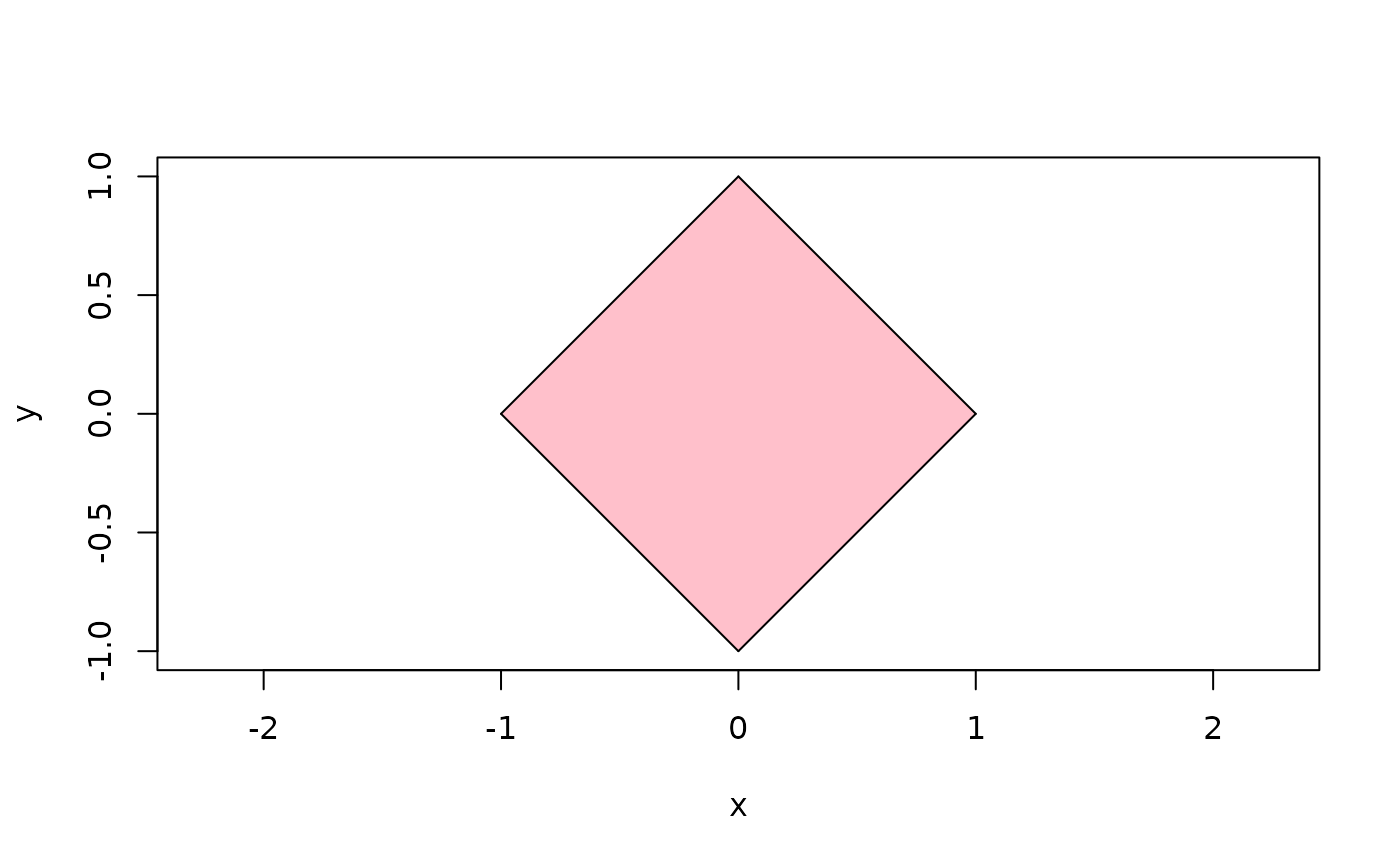
Plot a bounded Voronoï 2D cell.
Arguments
- cell
a bounded Voronoï 2D cell
- border
color of the borders of the cell;
NAfor no color- color
color of the cell;
NAfor no color- check.bounded
Boolean, whether to check that the cell is bounded; set to
FALSEfor a small speed gain if you know that the cell is bounded- ...
graphical parameters for the borders
Value
No value, this function just plots the cell (more precisely, it adds the plot of the cell to the current plot).
Examples
library(tessellation)
centricSquare <- rbind(
  c(-1, 1), c(1, 1), c(1, -1), c(-1, -1), c(0, 0)
)
d <- delaunay(centricSquare)
v <- voronoi(d)
#> Voronoï diagram with one bounded cell.
cell5 <- v[[5]]
isBoundedCell(cell5) # TRUE
#> [1] TRUE
plot(centricSquare, type = "n", asp = 1, xlab = "x", ylab = "y")
plotBoundedCell2D(cell5, color = "pink")