Plot a 2D Delaunay tessellation.
Arguments
- tessellation
the output of
delaunay- border
the color of the borders of the triangles;
NULLfor no borders- color
controls the filling colors of the triangles, either
FALSEfor no color,"random"to userandomColor, or"distinct"to usedistinctColorPalette- hue, luminosity
if
color = "random", these arguments are passed torandomColor- lty, lwd
graphical parameters
- ...
arguments passed to
plot
Examples
# random points in a square
set.seed(314)
library(tessellation)
library(uniformly)
square <- rbind(
c(-1, 1), c(1, 1), c(1, -1), c(-1, -1)
)
ptsin <- runif_in_cube(10L, d = 2L)
pts <- rbind(square, ptsin)
d <- delaunay(pts)
opar <- par(mar = c(0, 0, 0, 0))
plotDelaunay2D(
d, xlab = NA, ylab = NA, asp = 1, color = "random", luminosity = "dark"
)
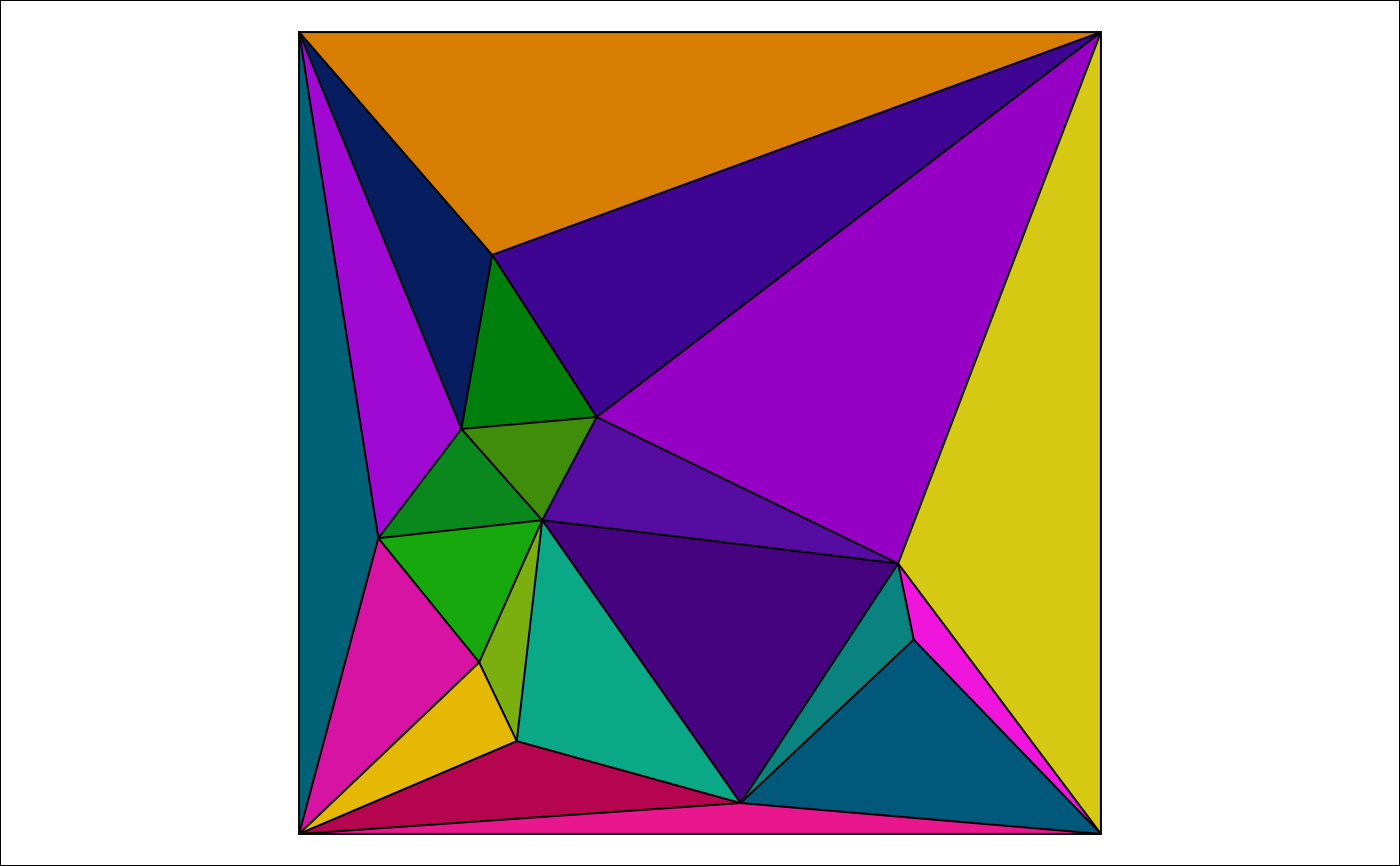 par(opar)