An edge is given by two vertices in the 2D space,
named A and B. This is for example an edge of a Voronoï cell
of a 2D Delaunay tessellation.
Methods
Method print()
Show instance of an Edge2 object.
Method plot()
Plot an Edge2 object.
Examples
library(tessellation)
centricSquare <- rbind(
  c(-1, 1), c(1, 1), c(1, -1), c(-1, -1), c(0, 0)
)
d <- delaunay(centricSquare)
v <- voronoi(d)
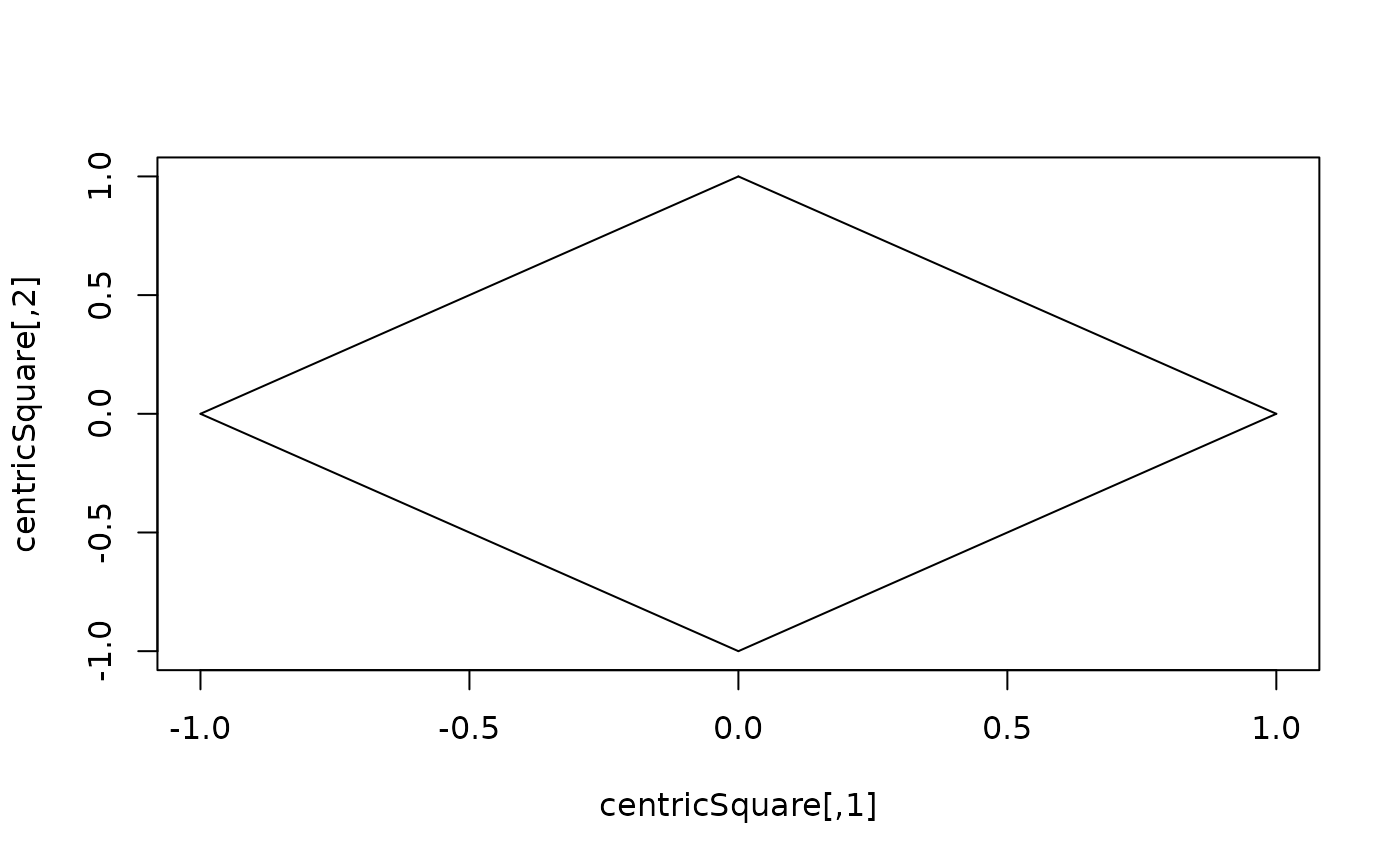
cell5 <- v[[5]] # the cell of the point (0, 0), at the center
isBoundedCell(cell5) # TRUE
plot(centricSquare, type = "n")
invisible(lapply(cell5[["cell"]], function(edge) edge$plot()))
Method stack()
Stack the two vertices of the edge (this is for internal purpose).
Examples
## ------------------------------------------------
## Method `Edge2$new`
## ------------------------------------------------

edge <- Edge2$new(c(1, 1), c(2, 3))
edge
#> Edge:
#>  vertex A: 1, 1
#>  vertex B: 2, 3
edge$A
#> [1] 1 1
edge$A <- c(1, 0)
edge
#> Edge:
#>  vertex A: 1, 0
#>  vertex B: 2, 3

## ------------------------------------------------
## Method `Edge2$print`
## ------------------------------------------------

Edge2$new(c(2, 0), c(3, -1))
#> Edge:
#>  vertex A: 2, 0
#>  vertex B: 3, -1

## ------------------------------------------------
## Method `Edge2$plot`
## ------------------------------------------------

library(tessellation)
centricSquare <- rbind(
  c(-1, 1), c(1, 1), c(1, -1), c(-1, -1), c(0, 0)
)
d <- delaunay(centricSquare)
v <- voronoi(d)
#> Voronoï diagram with one bounded cell.
cell5 <- v[[5]] # the cell of the point (0, 0), at the center
isBoundedCell(cell5) # TRUE
#> [1] TRUE
plot(centricSquare, type = "n")
invisible(lapply(cell5[["cell"]], function(edge) edge$plot()))
